Where Did 7.3 MWp Come From? How Ingro Sims Finds an Auditable Size
Ingro Sims sizes solar and storage from 8,760 hours of a site's own behaviour, never averaged. On one site that search lands at 7.3 MWp with 25 MWh: 90% of consumption from its own solar, break-even in 4.9 years and a 23.6% IRR.
“Where did 7.3 MWp come from?” The honest answer much of the industry gives is: experience, a rule of thumb, and a spreadsheet that was right once.
Ingro Sims answers it differently. Every site has its own rhythm, so Sims reads the site hour by hour across a full year, weighs every practical solar and solar-plus-storage design against it, and shows why one wins. Solar sizing, with or without storage: 8,760 hours, every size, one answer you can audit.
The engine: every hour solved, never averaged
The model uses a full year of the site's own behaviour — 8,760 hours, never averaged, because the average hides the two hours a day that decide whether storage pays. Storage physics, real power limits, round-trip losses and tariff timing are carried through every hour.
On the example site, a year of 12,264 MWh of solar generation meets 10,506 MWh of consumption like this:
- Direct — 2,378 MWh: used the moment it is generated
- Shifted — 7,077 MWh: stored (9,080 MWh into the battery), then carried into the hours that cost most
- Grid — 1,050 MWh: only whatever is genuinely left
Battery round-trip losses come to 2,003 MWh and curtailed solar surplus to 806 MWh. The tariff shows why timing matters: ₹17.54 at 7 PM against ₹11.93 at noon. Timing is the design variable.
The search: narrow the field, prove what is left
- Start from a year of the site's own behaviour.
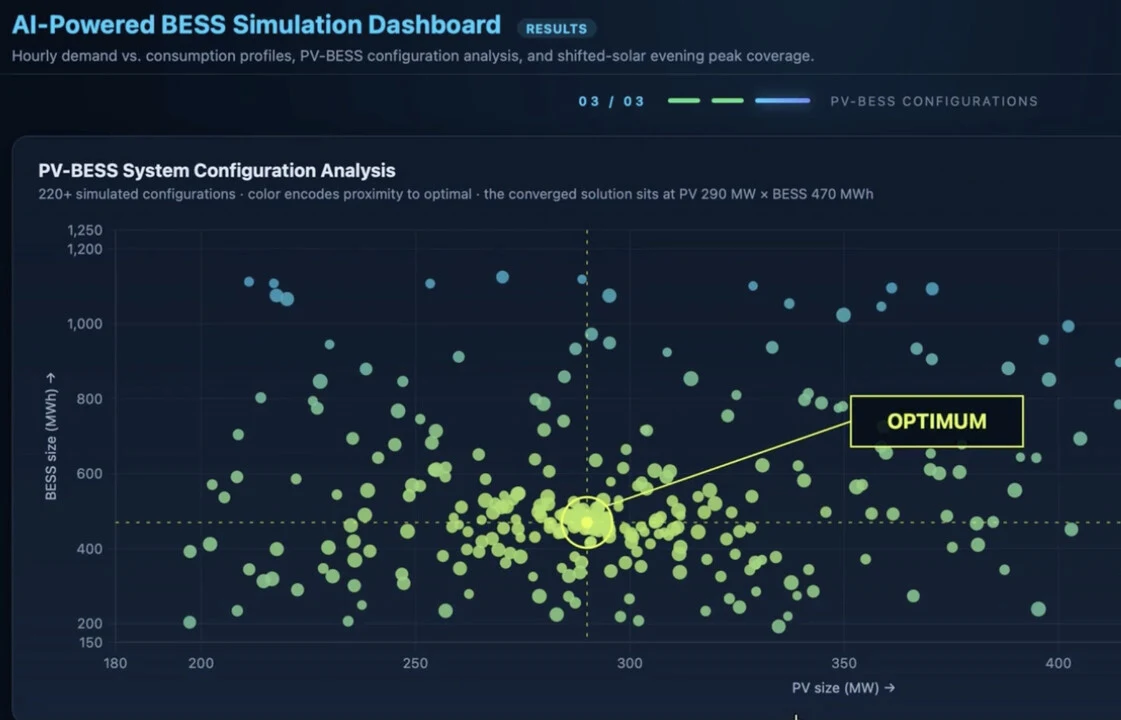
- A constrained optimisation layer narrows the field to the region of designs worth proving.
- The hourly engine simulates every design inside it across the whole year, so the full trade-off landscape stays visible.
The same simulated year can then be ranked by what you optimise for: lowest bills, least grid, least surplus, best balance, or solar only. On this site the best-NPV design is 7.3 MWp with 25 MWh.
The commercial engine: finance case attached
Every hour the engine simulates is also priced, so the same model that picks the size hands finance a cash case, pre-tax and unlevered. For this build:
- Paid once, on day one: ₹74.09 Cr
- Bills never paid over 15 years: ₹290.73 Cr
- Break-even: 4.9 years, ₹211.3 Cr ahead by year 15
- Project IRR: 23.6%
- 90% of consumption served by the site's own solar; 1,050 MWh still bought from the grid
Three principles hold the numbers together. Baseline-honest: savings are measured against what the site runs today, never a grid-only strawman. Net cash: running costs, GST credit and battery replacement sit inside every year. Solved: payback, break-even and IRR are solved on that series, never quoted.
Energy and economics, solved as one model. Not proposed — found, and auditable.
Opens the original post on LinkedIn — like, comment, or share it there.